Mitral Regurgitation Case Study!
Last week we walked through a case study demonstration, using the ASE’s chronic mitral regurgitation (MR) algorithm. This week, we have another case study to present– let’s see how you quantify the severity of MR!
Our blog last week discussed the algorithm for determining the severity of chronic mitral regurgitation, provided by the ASE! If you missed it, you can find it here! Let’s use this information and work through a case study together!
Last week, we covered the basic anatomy of the mitral apparatus. We reviewed in detail, the various structures and their function. As we continue with our mitral regurgitation blog series, we want to touch next on, specific imaging windows to evaluate the mitral valve. Remember, when we examine the valve, we need to make sure we include all structures of the apparatus.
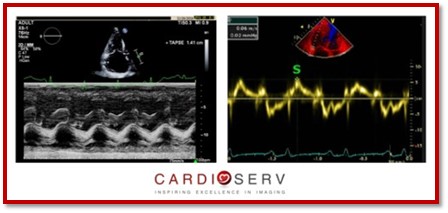
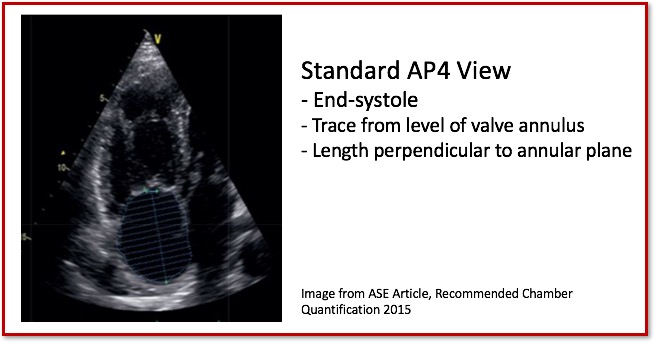
Before jumping into assessing the RV with the Fractional Area Change method, lets recap the past couple weeks. Last week, we talked about two methods for quantifying the function of the RV (TAPSE & S’ Wave). We selected these methods to explain first due to ease, reproducibility and established prognostic value. As some of our readers pointed out and as we discussed the TAPSE and S’ Wave methods do have limitations though. The 3 main limitations are:
We dedicated the month of April to learning about ways to implement right heart quantification into our routine exams. This month, we are going to continue that journey and discuss ways to evaluate the function of the right heart!
We have been discussing the importance of evaluating the right heart over the past few blogs this month. The ASE updated the chamber quantification guidelines that provided us with the correct methods to measuring size and function of the right ventricle (RV) and atrium (RA). This week, we are going to talk about the proper method to measuring the size of the right atrium! We will review both the preferred volumetric measurement methods and the linear measurements of the right atrium.
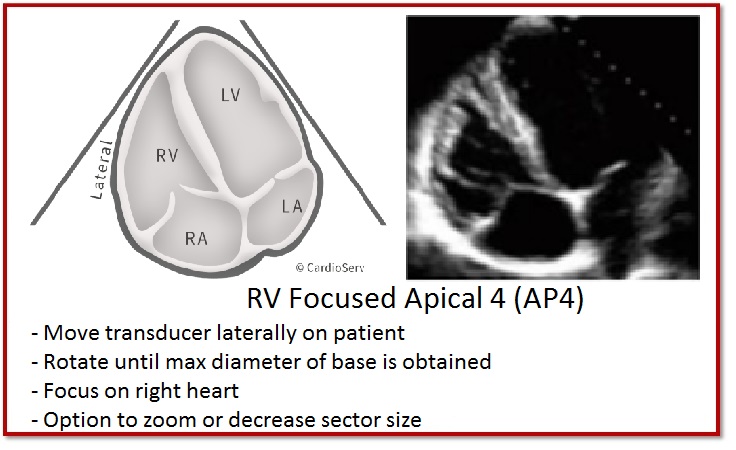
We recently reviewed basic right heart anatomy and outlined the ASE updated recommendations for quantifying right heart size and function. For the 2nd part of our Right Heart blog series, we are going to discuss proper measurements for size evaluation of the right ventricle (RV).
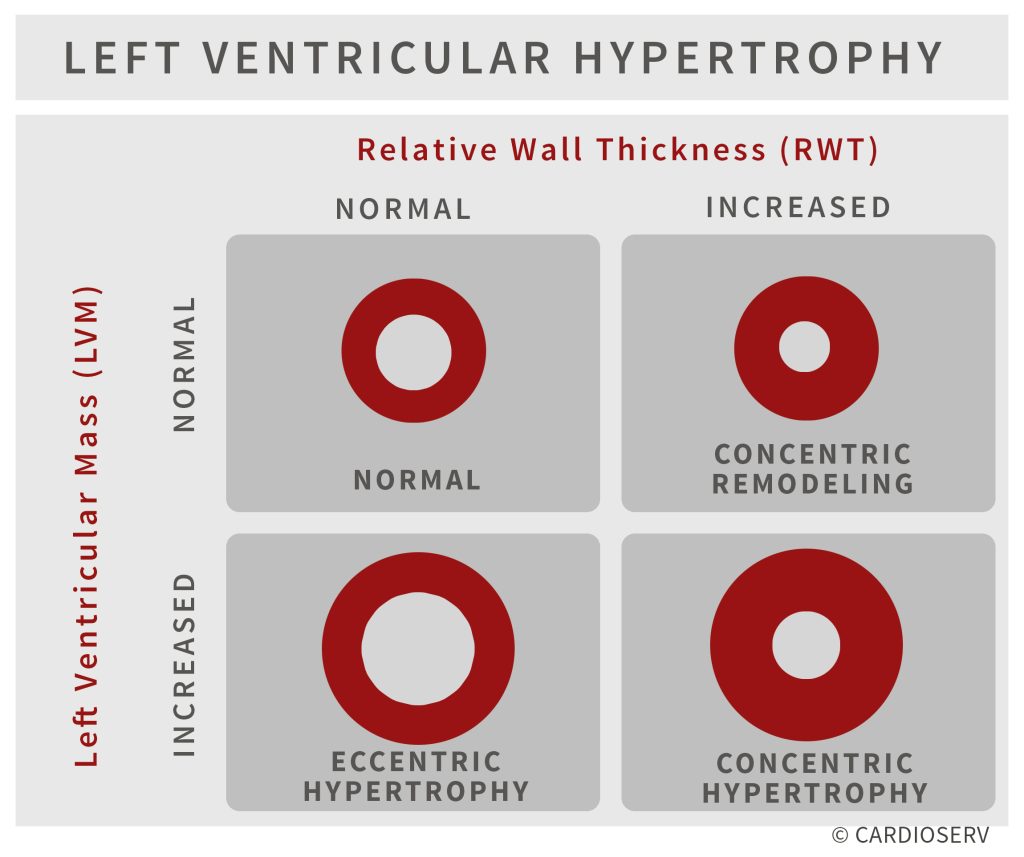
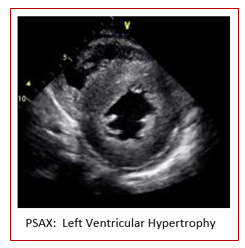
As diagnostic imaging professionals, we often perform echocardiograms on patients with hypertension to monitor the thickness, strength and wall motion of the heart. Last week we launched our two-part blog on left ventricular hypertrophy (LVH). In part one we explained the pathophysiology behind the various categories of LVH along with the echocardiographic findings. We discussed how LVM and RWT plays a role in identifying the categories of LVH. This week we will answer the question: What is LVM and RWT and how do we obtain these values?
Last month was designated American Heart Month to raise awareness of cardiovascular disease, the leading fatality of Americans. AHA encourages our patients to take control over understanding their risk factors of heart disease including knowing their numbers related to blood pressure. Untreated hypertension can have a long-term effect on the heart causing hypertensive heart disease, which can include coronary heart disease (CAD), left ventricular hypertrophy (LVH) and hypertrophic cardiomyopathy (HCM).
HOW COULD I IMPROVE THIS IMAGE?
Modality: Transthoracic Echocardiography
View: Subcostal long axis IVC
ANSWER:
The image could be optimized to elongate the IVC to ensure the correct diameter is measured.